PitMap

Know where the gold is before you move a machine.

PitMap turns the soil and rock sampling results from your PML into a gold anomaly map of the licence and marks the spots worth digging, with GPS coordinates you can walk to.

Your licences, samples and targets are seen by you alone.

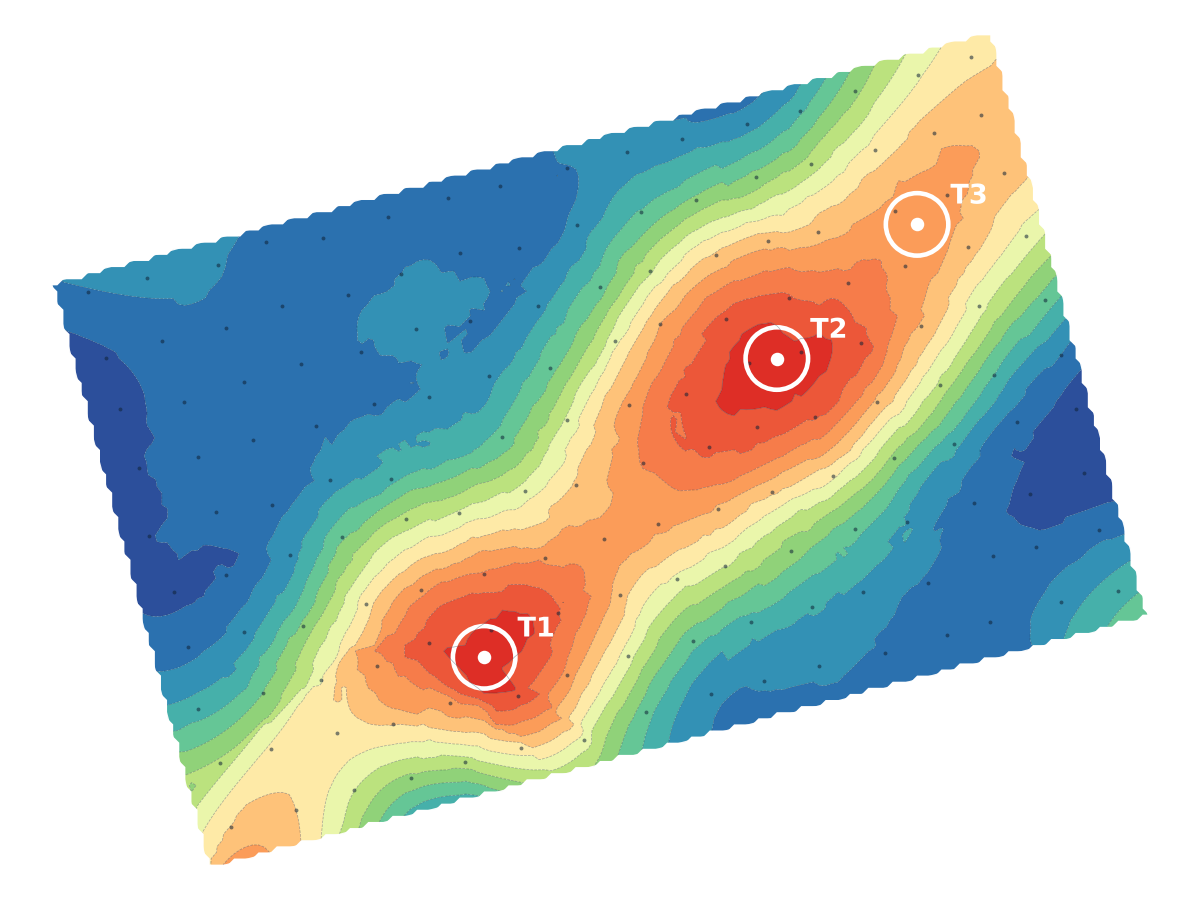
Hot-spot map of a demonstration licence: a north-east trending gold anomaly with three dig targets marked T1, T2 and T3.
Demo licence near Geita. 159 soil samples. Target T1 holds 1.95 ppm, 11 m from the nearest sample.

A wrong pit is the most expensive mistake on a licence.

Machine hire, fuel, labour and weeks of work go into every pit. A few hundred soil samples cost a fraction of that, but only if someone reads them properly. PitMap does the reading: it grids your results with the methods geologists use (kriging, inverse distance, minimum curvature, triangulation), picks the one that fits your samples best, and tells you how sure it is.

Built in Tanzania for holders of primary mining licences (PML) and prospecting licences, from Geita, Kahama and Mara to Chunya, Singida and the Lake Victoria goldfields.
From lab results to dig targets

  1. Add the licence

    Its name and the corner coordinates from the licence certificate. Arc 1960 or WGS 84, PitMap checks which one you mean.

  2. Upload the lab results

    CSV or Excel, as the lab sent it. Columns are matched for you, and wrong coordinates or below-detection values are flagged before anything is mapped.

  3. Read the map

    The hot spots, the direction the gold runs, and the best targets ranked, each with GPS, a "Go there" button, and an estimate of pit volume in truckloads.

How many samples you need

On a full 10 ha PML, what matters is how far apart the samples are compared with the width of the gold zone. Below, the same narrow zone (orange) sampled three ways.

About 20–25 samples at 70 m

No sample lands in the gold zone.

A rough picture. It can find a broad anomaly but can miss a narrow vein zone completely, and the mapping has to stay simple.

About 40 samples at 50 m

3 samples land in the gold zone.

A good first pass. It shows where the gold is and which way it runs.

About 160 samples at 25 m

12 samples land in the gold zone.

Good for choosing pit spots. Every target sits close to real samples.

The economical way: about 40 samples at 50 m over the whole licence, then 30–60 more at 25 m only around the hot spot. PitMap shows where to put them. Sample in lines across the direction the reefs run, not along it.

What you find stays yours.

What each map gives you

Ranked dig targets
The strongest spots, how far each is from a real sample, and whether it needs more sampling first.
The trend of the gold
Which way the anomaly runs, so the next pits and trenches follow it rather than cross it.
Pit and trench planning
Draw a pit or a trench on the map and get the volume, tonnes and truckloads.
Where to sample next
Gaps and open edges where more samples would change the picture most.
A report to hand over
A clean PDF with the map, targets and method, for a partner, a buyer or your own records.
Profile and 3D views
Cut a line across the anomaly, or turn it in 3D to see its shape.

Pay per map, not per month.

No subscription. You buy credits and use them only when you need a map, a target or a report. If a map fails, nothing is charged.

Everything is free while PitMap is in its launch period.

Upload and check your lab resultsFree
Hot-spot map of a licenceTZS 60,000 per 10 samples, at least TZS 300,000. The first map of every licence is free.
Other methods on the same samplesFree for 30 days
Exact spot and GPS of a dig targetTZS 150,000 per target
PDF reportTZS 150,000
Grid, contour and target filesTZS 90,000
Everything on one map: all targets, PDF and filesTZS 600,000

See it on a demo licence first.

Create an account and open the demo licence: real soil samples, a finished map and three targets. No data of your own needed.