Free · no login · installs on your phone

Terrain lineaments, examined in profile.

GoldRadar maps terrain-derived lineaments and examines elevation profiles across them to identify scarps, valleys, ridges and low-relief features. These are topographic observations, not confirmed geological faults.

Use the terrain-profile classifications and intersections to prioritise independent geological checks before committing field resources.

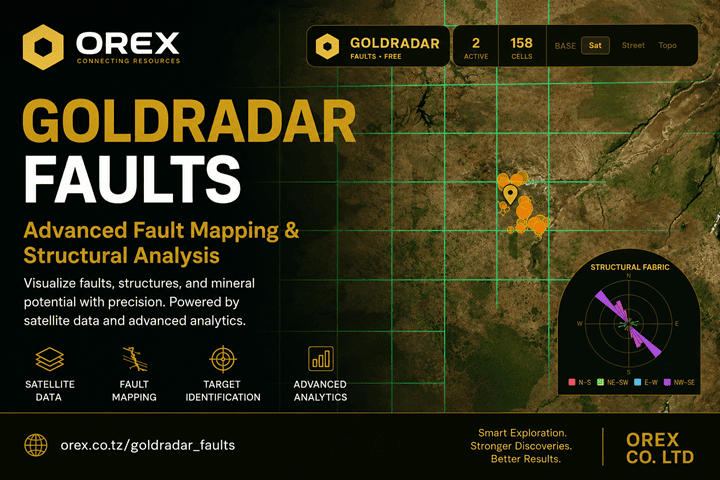
GoldRadar — fault mapping and structural analysis from satellite elevation data
Lineaments, intersection targets and terrain-profile classes across the half-degree QDS grid.
⚠

Read this first. These lines come from terrain shape, not from a geologist standing on the outcrop. Terrain profiles describe the relief across a mapped lineament; they do not prove the structure is a fault, and nothing here detects gold or any other metal. It narrows where to look. Assays settle it.

The problem

Not every lineament is a geological fault.

Lineaments can reflect faults, fractures, drainage, resistant rock units, roads or other landscape features. Elevation profiles add useful context, but cannot determine the geological origin of a feature on their own.

The reverse trap matters just as much: a fault may have little or no surface relief, especially where it is buried or weathered. Low relief is a reason for caution in both directions — it is not proof of a road, and it is not grounds for writing a feature off as non-geological.

🗺

Before you buy ground

Comparing licences? Compare mapped lineament trends, profile classes and geological context before planning further investigation.

📏

Before you lay out samples

Sample lines belong across the structural trend, not along it. The fabric rose gives you the trend and how consistent it is.

⛓

Before you move a machine

Lineament intersections may warrant field inspection when supported by geology, geochemistry or other evidence.

Terrain profiles

See how lineaments appear in the terrain.

GoldRadar analyses elevation profiles across mapped lineaments and assigns terrain-expression classes. The results help distinguish different topographic patterns, but are not field measurements or proof of geological displacement.

Scarp

A step-like terrain profile with a measured elevation offset. This is topographic relief, not confirmed fault throw.

Valley

A valley-like notch along the mapped line. It may relate to erosion, drainage, rock properties or geological structure.

Ridge

A ridge-like crest along the line. Resistant lithology or other landscape processes may explain it.

Mixed

The terrain says different things at different points along the line. Reported honestly rather than averaged away. Treat with care.

Flat

Little detectable relief in the sampled terrain profile. It may be a road or field edge — or a real structure that is buried, weathered flat or hidden under alluvium. Flat lines stay on the map, but are excluded from the field radar's targets so nobody is routed down a track by mistake. That exclusion is a routing precaution, not a geological verdict: inspect them yourself where the setting warrants it.

📏

Elevation offset

An estimate of the height difference across a scarp-like terrain feature, not a measured geological fault displacement.

📊

Agreement along the line

What share of the sampled stations reached the same verdict. Agreement indicates consistent profile classification, not independently verified geological origin.

🎨

Colour by terrain class

One tap recolours the map from direction to verdict, so different terrain-expression classes can be compared visually.

The report

A printable structure report for a point or a licence.

Tap a point, or paste a licence boundary, and GoldRadar builds a full report of available structural-screening information within that window — readable on screen, downloadable as PDF, and available as JSON if you want the numbers in your own system.

Boundaries go in as decimal degrees, DMS, UTM, WKT or GeoJSON, in WGS 84 or Arc 1960.

Where this is — the point, the cell, the setting
Summary — the structure in plain words
The licence — boundary, corners, area
The window — what was examined
Mapped geology — the unit under the point
Structural fabric — trend and how consistent
Walking out from the point — all eight bearings
Structures inside the window, with verdicts
Structures just outside the boundary
Crossings and nodes
Where to work next
How to read the numbers
Where these numbers came from

The last two sections are deliberate. Anyone you hand this to — a partner, a buyer, a lender — is entitled to see how a number was produced and what it does not mean. Where a national survey publishes its geological map, the report also names the unit under the point, the units sharing the window, and where a structure crosses a mapped contact.

In the field

And a radar to walk you to it.

Desk work is only half of it. The field radar turns a target into a bearing and a distance, and handles the things that actually go wrong on a licence.

🧭

Go to a structure

Distance, bearing, track and speed, with a compass rose and satellite imagery in the circle. Targets are drawn from lines with measurable relief. Check the classification before you set out — GPS guidance does not establish geological validity.

📍

Find your licence

Paste the boundary and it guides you to the edges and to each corner peg. Coordinates in DD, DMS or UTM, in WGS 84 or Arc 1960, with position averaging for a steadier fix.

🌇

Get back before dark

A sunset and walk-back warning based on where you are and how far out you have come. You can also measure an area by walking its boundary.

Straight answers

What elevation data can and cannot tell you

Most remote-sensing products are vague about this. Here is the whole picture, so you can judge for yourself what the map is worth on your ground.

Measurable

  • Where a lineament runs, and which way it trends
  • How much relief sits across it, in metres
  • Intersections and bends, as geometry
  • Escarpments and abrupt terrain breaks
  • Drainage pattern and catchments
  • Terraces, palaeochannels and alluvial geometry

Suggestive only

  • Whether a lineament is a fault at all
  • Major shear zones — as deformation corridors
  • Fault splays, where they shape the terrain
  • Large folds — curved or repeating ridges
  • Fracture networks — only the larger ones
  • Lithological contacts — via erosion resistance
  • Granite contacts — terrain hints, not lithology

Needs other data

  • Buried faults under soil or alluvium — magnetics
  • Rock type — geological maps, field mapping
  • Alteration minerals — satellite spectra
  • Permeability and fluid pathways — IP, geophysics
  • Grade, and any metal at all — assays
  • Anything at depth — geophysics, drilling

These are qualitative capabilities, not accuracy ratings. Results depend on DEM resolution, terrain, weathering, vegetation and the geological setting. Structure tells you where something might sit; rock type and geochemistry decide which mineral system, if any, is relevant. A buried fault under mbuga or alluvium may leave no trace in the terrain at all — that is exactly the case where magnetics earns its keep.

Access

Explore free. Commission deeper analysis when needed.

The free GoldRadar explorer uses satellite-derived elevation data (DEM) to screen structural lineaments in available analysed areas across Africa. Other regions can be considered on request. For deeper investigations, Orex offers private exploration intelligence for potentially prospective areas, as well as commissioned evaluations of existing licences and defined areas.

Free forever

Free Explorer

Free
no login, no card

For available mapped areas across Africa; additional regions worldwide can be assessed on request.

  • Lineaments across the QDS grid
  • Terrain profiles on every line, with terrain elevation offsets
  • Automatic intersection detection
  • Fabric rose with a consistency percentage
  • Point and area screening reports, where supported
  • Field radar with GPS go-to and boundary walking
  • Installable web app; offline capabilities depend on cached data
Open the map
Private exploration intelligence

Exploration Intelligence

Request a quote
priced by area and deliverables

For individuals, investors and exploration companies looking for potentially prospective mineral exploration areas.

  • Potential exploration areas available for purchase
  • Target coordinates and defined area boundaries
  • Maps, available GIS data and exploration intelligence reports
  • Research for specified locations on request
  • The evidence behind each target, and the reasoning
  • Independent verification and mineral-rights checks remain essential
Request intelligence
Area-specific research

Licence & Area Evaluation

Contact for a quote
priced by area and research scope

Already hold a licence or considering acquiring a specific area? Request an independent exploration assessment.

  • Evaluation of an existing licence or defined area
  • Review of available geological and exploration information
  • Identification of potentially prospective zones within the area
  • Maps, target coordinates and supporting intelligence
  • Clear opportunities, uncertainties and suggested next steps
Request an area evaluation
Private exploration intelligence

Discover potential mineral exploration areas

Beyond the free GoldRadar application, Orex offers privately researched mineral exploration opportunities across Africa and other regions on request. We provide location-specific intelligence to individuals, investors, licence holders and exploration companies seeking new opportunities.

Each area is built from more than the free map shows: terrain structure and profile classes, the national licence cadastre, published geological sheets and survey scans, satellite alteration indices where coverage exists, and drainage and catchment geometry — read together rather than one layer at a time.

Clients can purchase target coordinates, defined boundaries, maps, available GIS data and supporting exploration reports, or commission an evaluation of an area they already hold or are considering. You receive the evidence behind every target and the reasoning that led to it; the processing systems themselves stay in-house.

Potential exploration areas are research hypotheses, not verified mineral discoveries or resource estimates. Buyers must independently check mineral rights, obtain any required permissions and verify targets through appropriate geological investigation before making investment decisions.
Where it fits

Structure narrows the ground. Assays settle it.

GoldRadar and PitMap do two different jobs, in order. One tells you where to spend your sampling budget. The other reads the results when they come back.

Step one — free

GoldRadar

Mapped terrain lineaments across the area, with their profile classes and trend. Where to concentrate a first pass, and which features to verify first.

→
Step two — your own assays

PitMap

Soil and rock results turned into a hot-spot map with ranked dig targets and GPS points. Measured gold, not inference. See PitMap →

Look at your ground before you spend on it.

No account, no card, no sales call. Open the map, find your area, and see how its lineaments sit in the terrain.